Process Operability Overview#
What is process operability?#
The underlying problem: Design and control#
This question must be answered before diving into the nitty-gritty details that involve operability analysis.
When designing a chemical process/plant, two main tasks naturally arise, when considering the processing of raw materials into value-added products such as chemicals or energy:
Process design: Which decisions should be made with respect to the design variables of a given process, in a way that its overall objectives are achieved (economic profitability, constraints related to product purity/pollutant emissions, etc.)?
Control objectives: Which variables should be controlled, yielding the maximum operability of this process? That is, can the process “reach” its maximum operational capacity, given the ranges of the manipulated/input variables?
Historically, tasks 1 and 2 were performed in a sequential manner: Firstly, an engineer/practitioner would come up with the design decisions, and only then the control objectives are assessed. Unfortunately, this can yield a process that is designed in a way that its operability capabilities are hindered. In other words, because the control objectives were not considered early in the design phase, the process itself might be not controlled or operable at all. To give you perspective on how challenging this problem is, there are reports dating back to the 40’s from Ziegler and Nichols [18] (The same ones from the controller tuning laws) stressing out about this problem, mentioning the importance of interconnecting design and control.
With this in mind, the need of quantifying achievability of a general nonlinear process naturally arises. The question: “Can one quantify achievability of process design and control objectives simultaneously?” was the underlying motivation for Prof. Christos Georgakis and his collaborators [12, 13, 15, 16] to formally define process operability and define a metric called the operability index.
Important
Process operability is a systematic framework to simultaneously assess design and control objectives early in the conceptual phase of industrial, typically large-scale, and nonlinear chemical processes.
To achieve the systematic assessment design and control objectives simultaneously, process operability is based on the definition of operability sets. These are spaces in the cartesian system that are defined with respect to the available inputs of a given process, their respective achievable outputs, the desired regions of operation in the input and output spaces and lastly, any expected disturbances that may be present.
In order to formalize this in mathematical terms, one requirement of process operability analysis is to have a process model \((M)\) readily available. This model can be derived from first principles, using a process simulator platform and/or machine learning-based methods (surrogate-based). The process model can be defined in many ways, as long as it meets the criteria detailed below. Following [12], let’s define a process model \(M\) with \(m\) inputs, \(p\) outputs, \(q\) disturbances and \(n\) states as:
In which \(u \in \mathbb{R}^m\) are the inputs, \(y \in \mathbb{R}^p\) are the outputs, \(d \in \mathbb{R}^q\) are the disturbances and \(x \in \mathbb{R}^n\) are the state variables. Also, \(f\) and \(g\) are nonlinear maps and \(h_1\) and \(h_2\) correspond to equality and inequality process constraints, respectively.
With the appropriate definition of the process model \((M)\), we can start defining the operability sets.
Operability sets#
For the sake of illustration, the operability sets will be shown here in the two-dimensional space \(\mathbb{R}^2\). However, all definitions carry over to any general dimensionalities.
The Available Input Set (AIS)#
The available input set (AIS) is defined as the region that encapsulates the lower and upper bounds for the input variables available in the system. These can be either design or manipulated variables. In short, they are the manipulated inputs (\(u \in \mathbb{R}^m\)) based on the design of the process that is limited by the process constraints:
Visually:
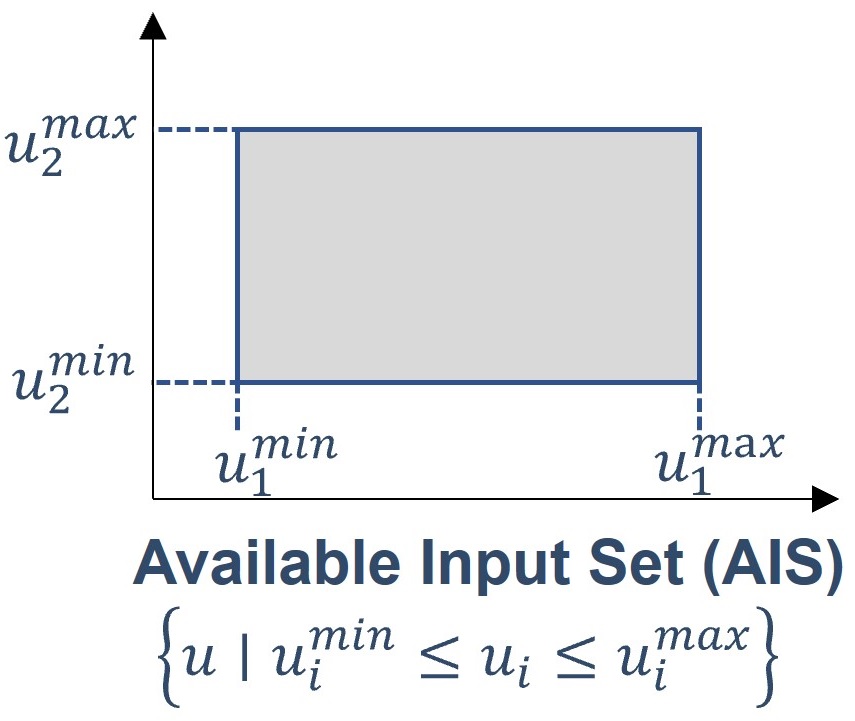
Fig. 1 Available Input Set (AIS)#
The Achievable Output Set (AOS)#
The Achievable Output Set (AOS) is defined as being the range of the outputs (\(y \in \mathbb{R}^n\)) that can be achieved using the inputs inside the AIS. It corresponds to everything that can be done in the output space given the ranges of the AIS. In mathematical terms, for a given fixed disturbance:
Visually:
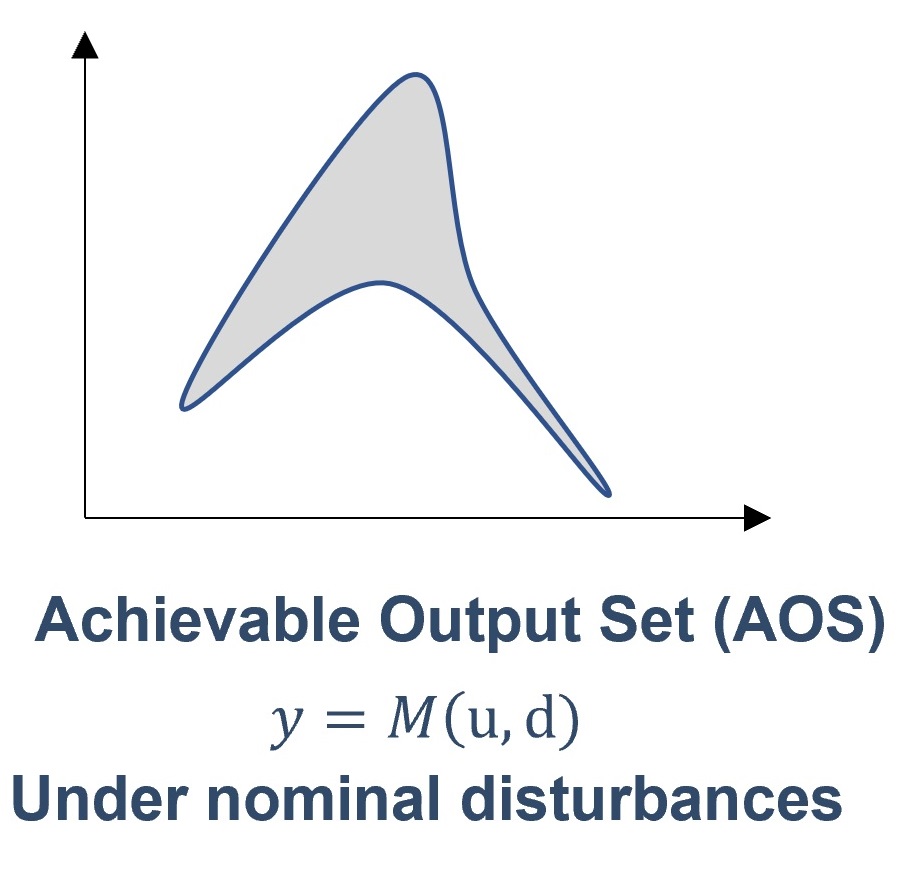
Fig. 2 Achievable Output Set (AOS)#
Important
Note that the pictorial representation of the AOS is drawn intentionally as a non-convex region. This is a result of the process model \((M)\) being potentially nonlinear: A convex AIS may lead to a non-convex AOS!
The AOS is obtained from the process model \((M)\), as depicted in the figure below:

Fig. 3 AIS-AOS relationship via process model \((M)\)#
The Desired Output Set (DOS)#
Despite the fact that the AOS can inform us what we can do with the current AIS region, we might desire to operate at a certain region given a variety of reasons, such as market demands, product purity specification, maximum pollutant emissions imposed by legislation and so on. Given this, the Desired Output Set (DOS) naturally arises to represent the production/target/efficiency requirements for the outputs that are not necessarily within the ranges of the AOS.
Visually, highlighted in red is the intersection between achievable and desired operations:
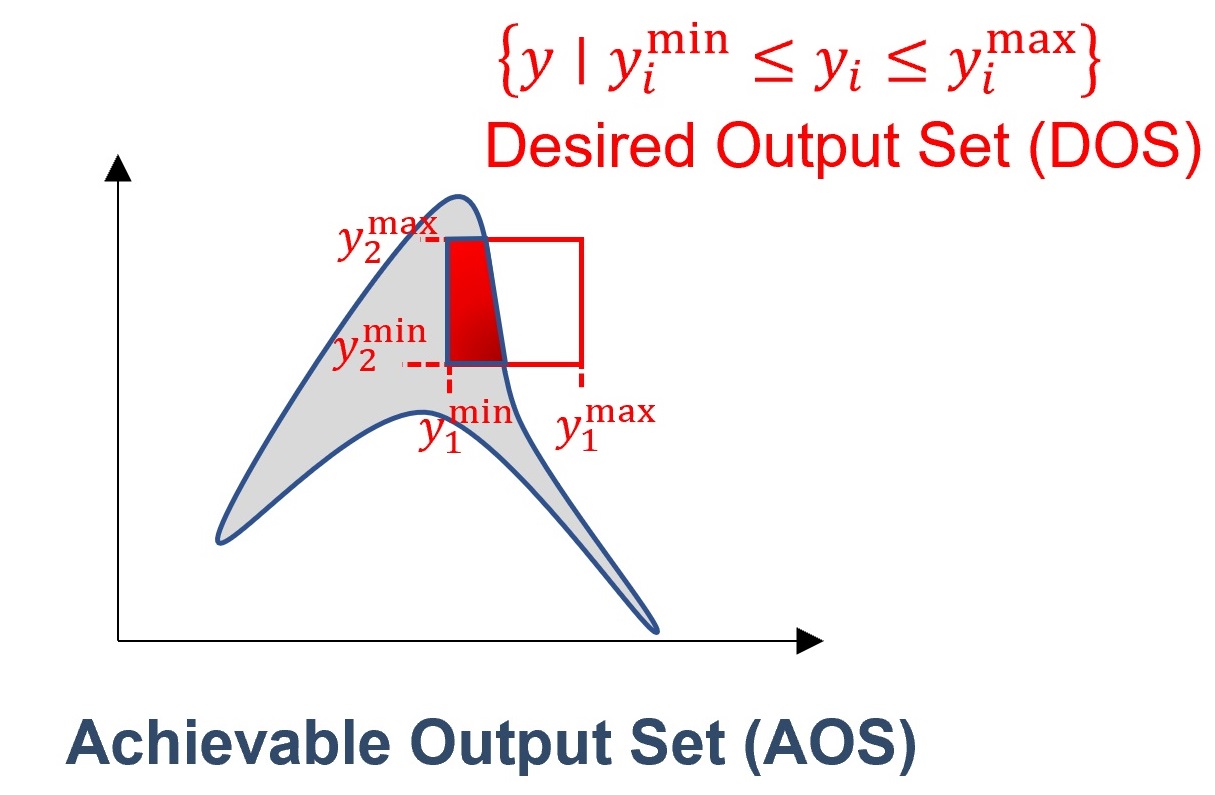
Fig. 4 Desired Output Set (DOS)#
The Desired Input Set (DIS)#
If there is a desired region of operation in the output space, there has to be a desired region of operation in the input space that guarantees that the DOS is achieved. This is denominated as the Desired Input Set (DIS): A set of inputs required to reach the entire DOS, given a disturbance vector \(d\):
Visually, highlighted in red is the intersection between available and desired operation in the input space:
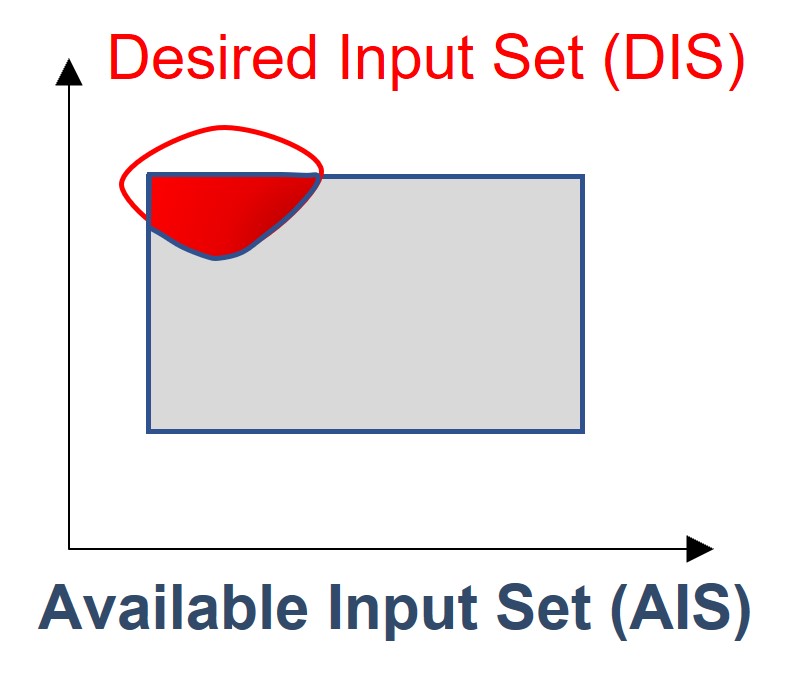
Fig. 5 Desired Input Set (DIS)#
Important
Note that the DIS is not fully contained within the original AIS. This is expected since the DOS was not fully contained within the AOS for this illustrative example.
In order to obtain the DIS, it is necessary to perform an inverse mapping task: That is, from a defined DOS, calculate the correspondent DIS in the input space. This is an inverse problem [3] that may be challenging to tackle. As a visual representation, let the inverse map of the process model \(M\) be represented as \(M^{-1}\), then the evaluation of the DIS follows the schematic:

Fig. 6 Inverse mapping from the DOS to the DIS#
The Expected Disturbance Set (DIS)#
Lastly, process disturbances may be present in a system. To represent this, we define the Expected Disturbance Set (EDS). This is composed of the disturbance variables, \(d \in R^q\), that can represent process uncertainties and variabilities. The effect of the EDS on the AOS is to shift it throughout the specified disturbance range:
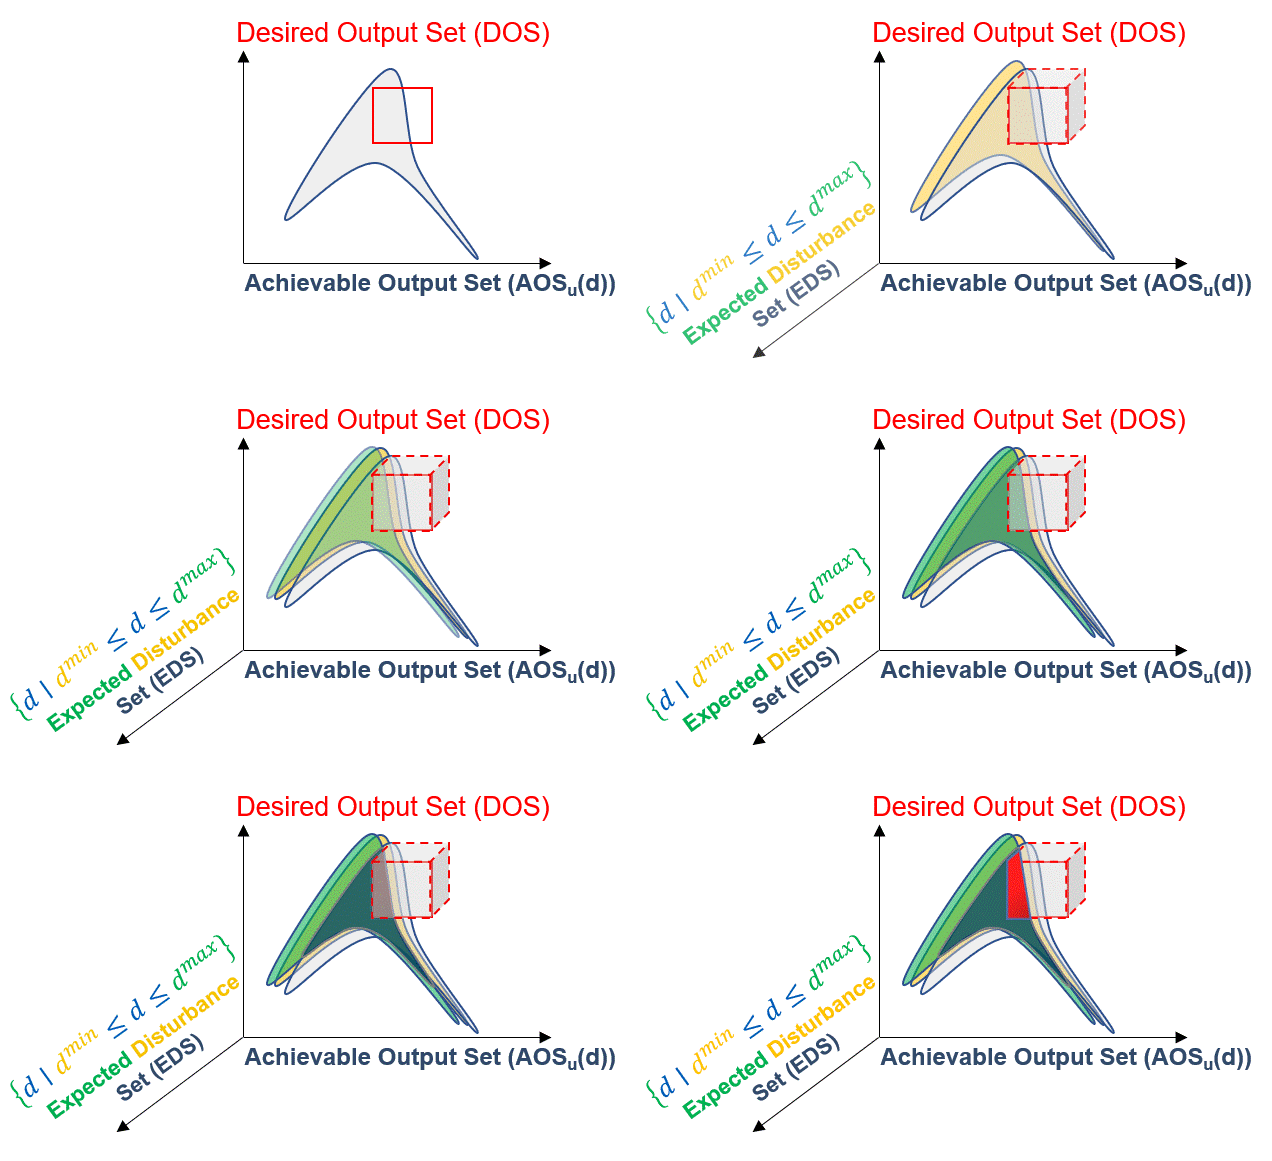
Fig. 7 Expected Disturbance Set (EDS) effect on the AOS#
Mathematically, the EDS is defined as:
The same effect is present in the input space, shifting the DIS for each disturbance scenario:
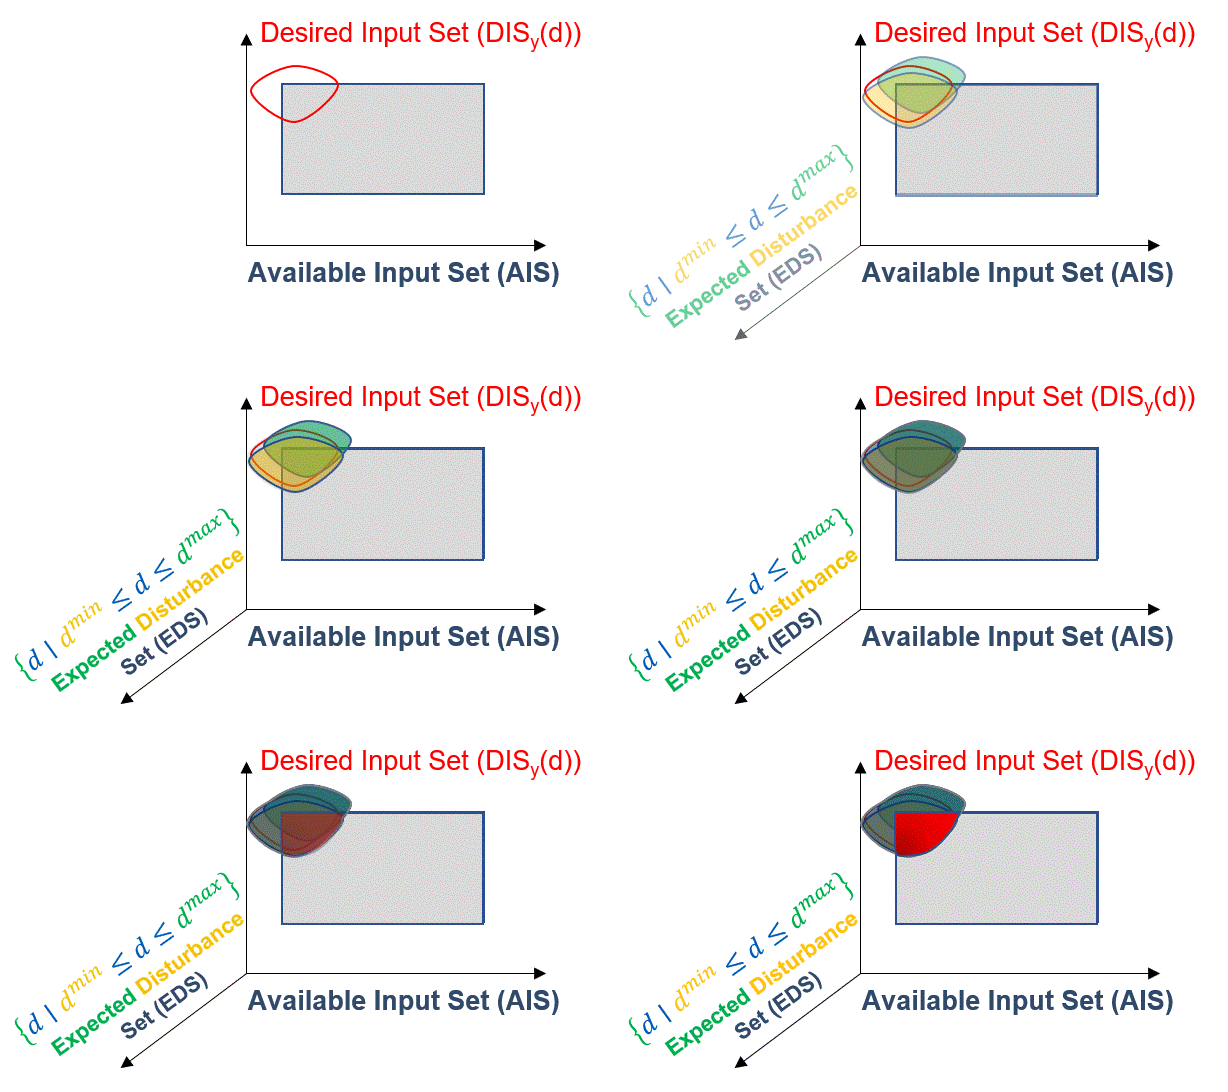
Fig. 8 Expected Disturbance Set (EDS) effect on the DIS#
Because of this shift, the AOS needs to be rewritten in the output space to reflect the intersection of each disturbance scenario:
and as a realization of the union of each DIS in the input space for each disturbance scenario:
In general, the overall effect of the EDS on both inputs and outputs can be visualized in the animation below:
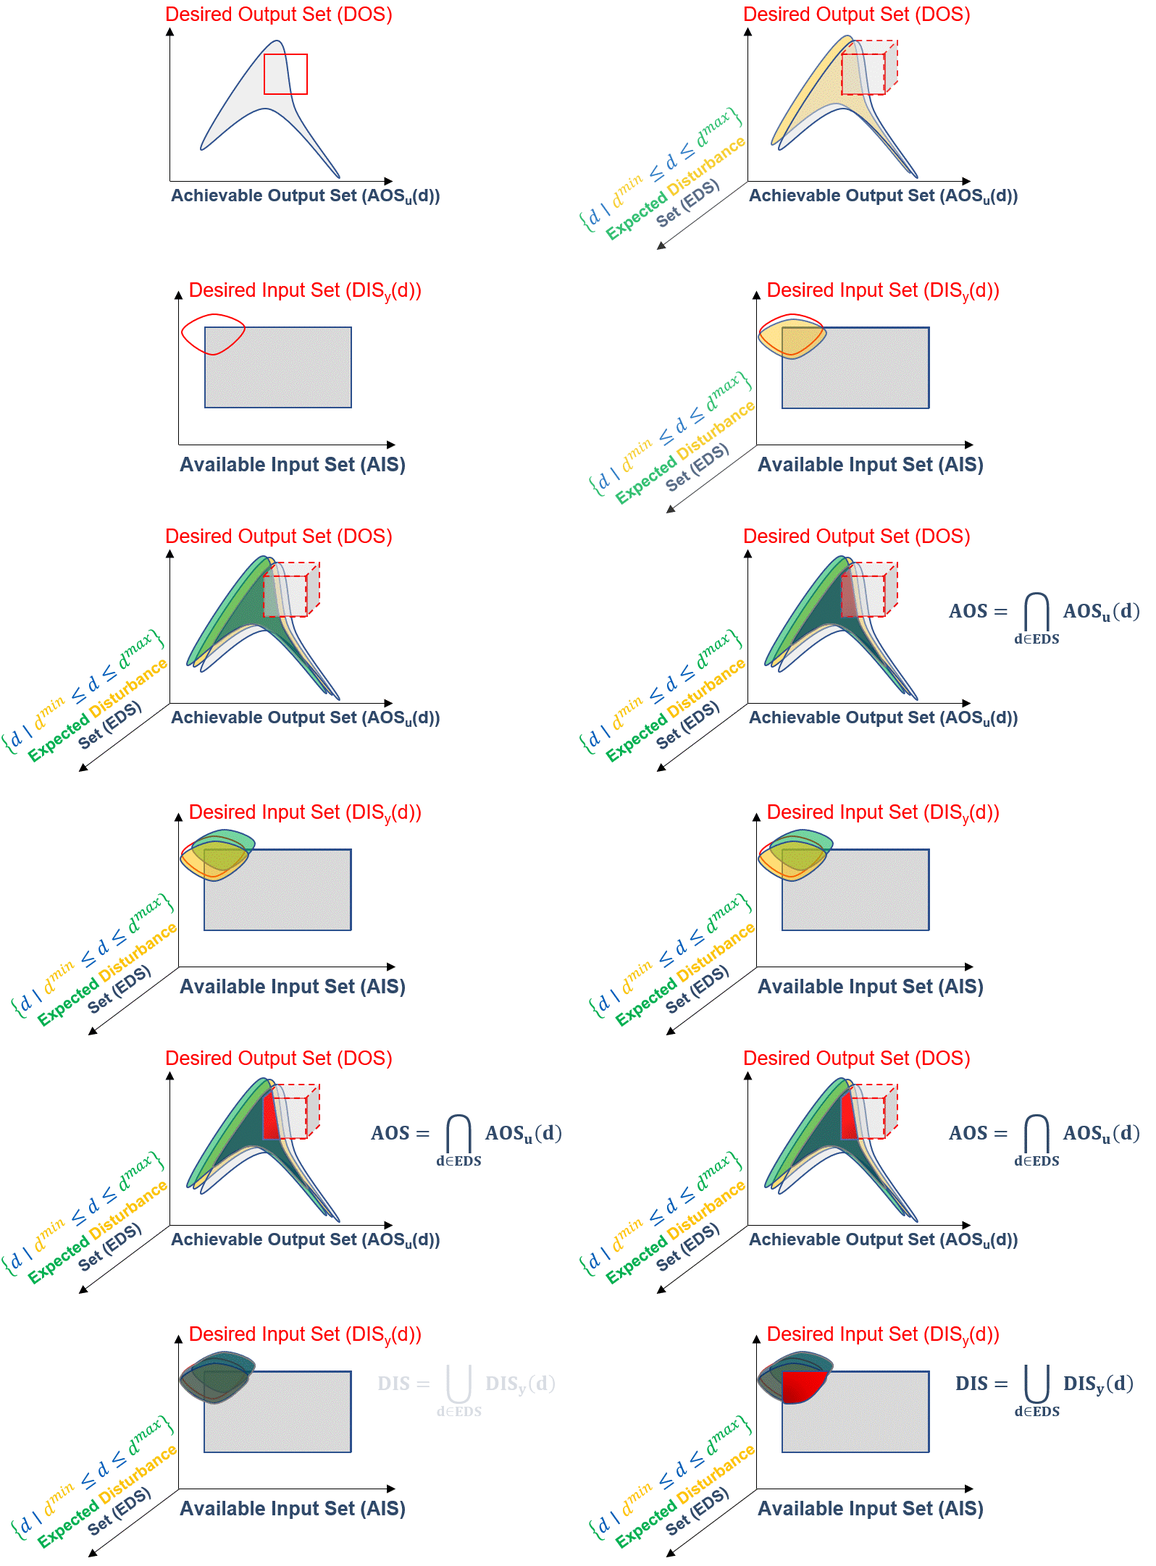
Fig. 9 Expected Disturbance Set (EDS) effect on the overall process model#
Now let’s go back and take a closer look at available, achievable and desired operability sets, in both input and output spaces:
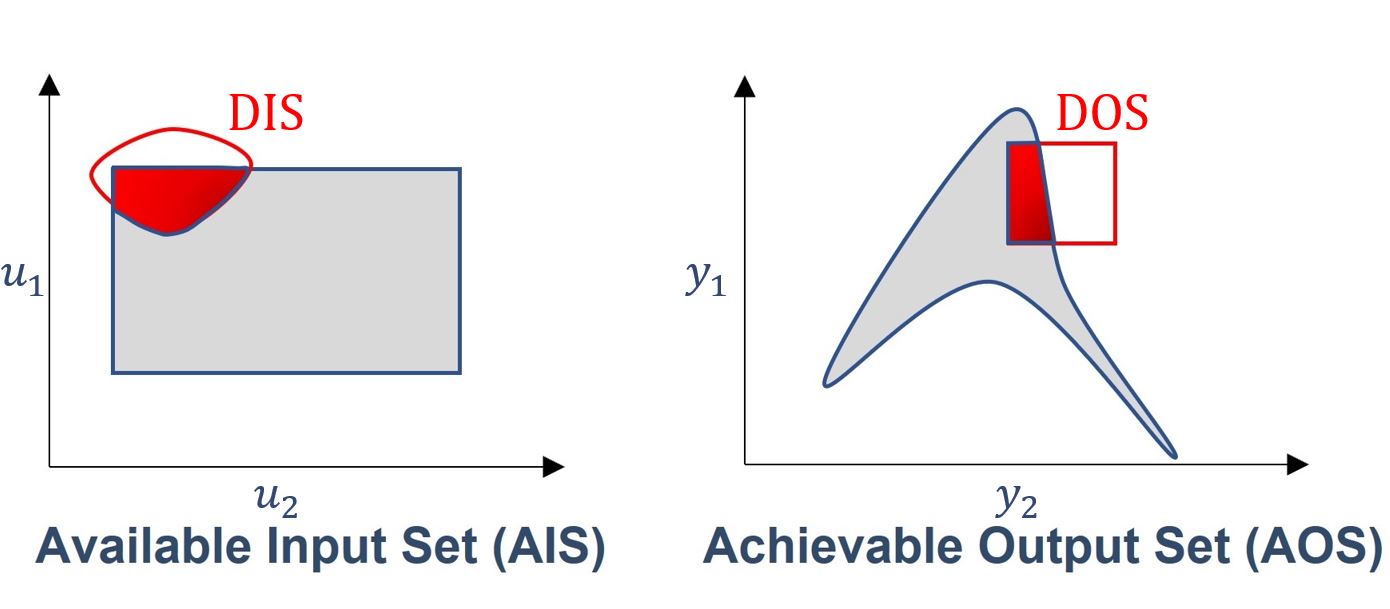
Fig. 10 Intersection between available/achievable and desired operations#
By inspecting the figure above, we can see that due to the geometric-based inherent nature of the operability sets, we are able to quantify achievability for any given process region, either in the input or output perspectives. This is represented in the figure above as the red-shaded area.
In other words, the intersection between the area of an AIS/AOS and the DIS/DOS will yield how much the analyzed process is operable. Since we are talking about areas, we can quantify the intersection of such areas and this will yield a Process Operability metric!
This leads to the definition of the Operability Index:
The Operability Index (OI)#
The Operability Index is defined as the metric that quantifies achievability via the intersection of available or achievable operations with their corresponding desired regions. Mathematically, this can be expressed as follows:
or
From the outputs and inputs perspectives, respectively. In the definitions above, \(\mu\) indicates a measure of regions that varies depending on the dimensionality of the considered sets [10, 13]. If in our example we had a 1D system, \(\mu\) would indicate length. Since we are in the \(\mathbb{R}^2\) space, it corresponds to area quantification. For 3D systems it would be the intersection between the volumes of the regions and for higher dimensional cases, hypervolumes. An additional important note is that due to the possible nonlinearity of the underlying process model, the OI value from the inputs’ perspective may yield a different value from the outputs’ perspective (and vice-versa). Using the OI from either perspective is a matter of convenience and the objective of the operability analysis: analyzing the operability in the output or input space.
Note that in both cases, the OI is normalized with respect to the desired region of operation. This makes the OI range between 0 (or 0%) when a process is not operable at all to 1 (or 100%) when a process is fully operable. The animation below illustrates a situation in which the process is not fully operable and then 100% operable:
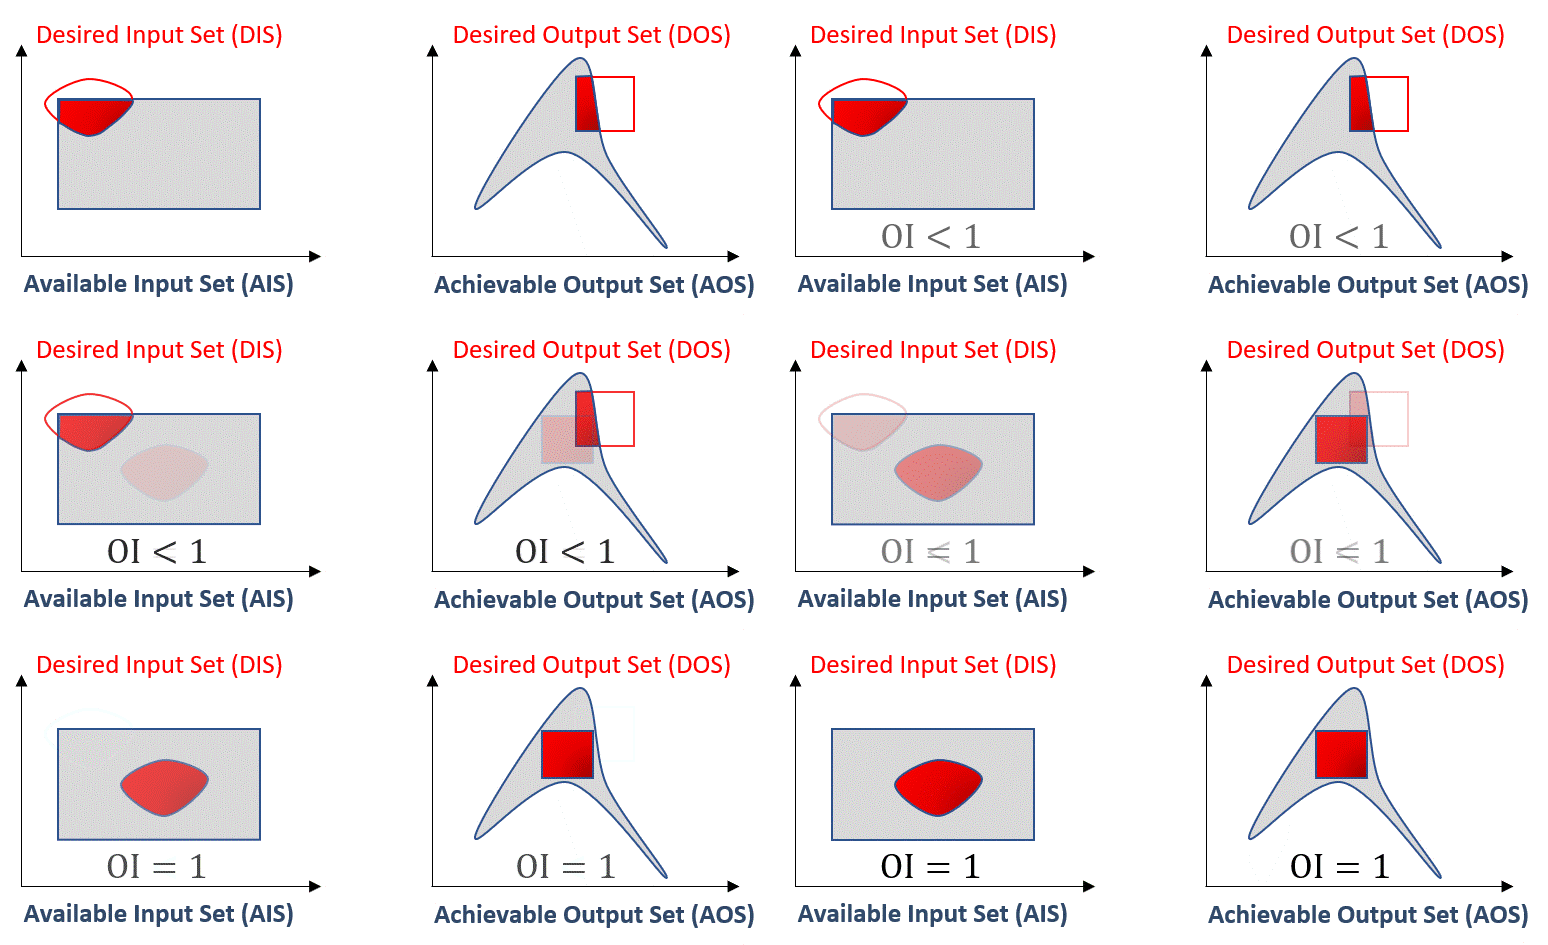
Fig. 11 Operability Index (OI) for different scenarios: not fully operable \(vs\) fully operable#
Important features of the OI#
The OI has interesting properties such as:
It corresponds to an inherently nonlinear measure [16]. This was, in fact, one of the original motivations for formalizing process operability analysis: to have a nonlinear measure of output controllability of any general chemical process, as a counterpart to measures of controllability that are classically available in the literature from linear systems control theory.
It is independent of the type of controller used [17]. This is one of the most important properties of the OI as one can analyze the system’s operability without the need of knowing how the controllers will be implemented (decentralized PIDs, MPC, etc.). This property is particularly important as well when analyzing the control structure selection problem.
It allows for disturbances’ evaluations under “worst-case” scenario situations. Since the OI is independent of the controller type and it can be interpreted as a fundamental characteristic of the system studied, the OI can give the best-case (or worst) disturbance rejection scenarios when one is accounting for disturbances in the operability analysis.
The next section will briefly cover the main algorithms that were developed in CODES research group to perform the main operability tasks: inverse mapping and operability set manipulations.
